
You’ve asked for more data about how schools and students are interacting with your company and career information in Compass – and now you can put that information to work.
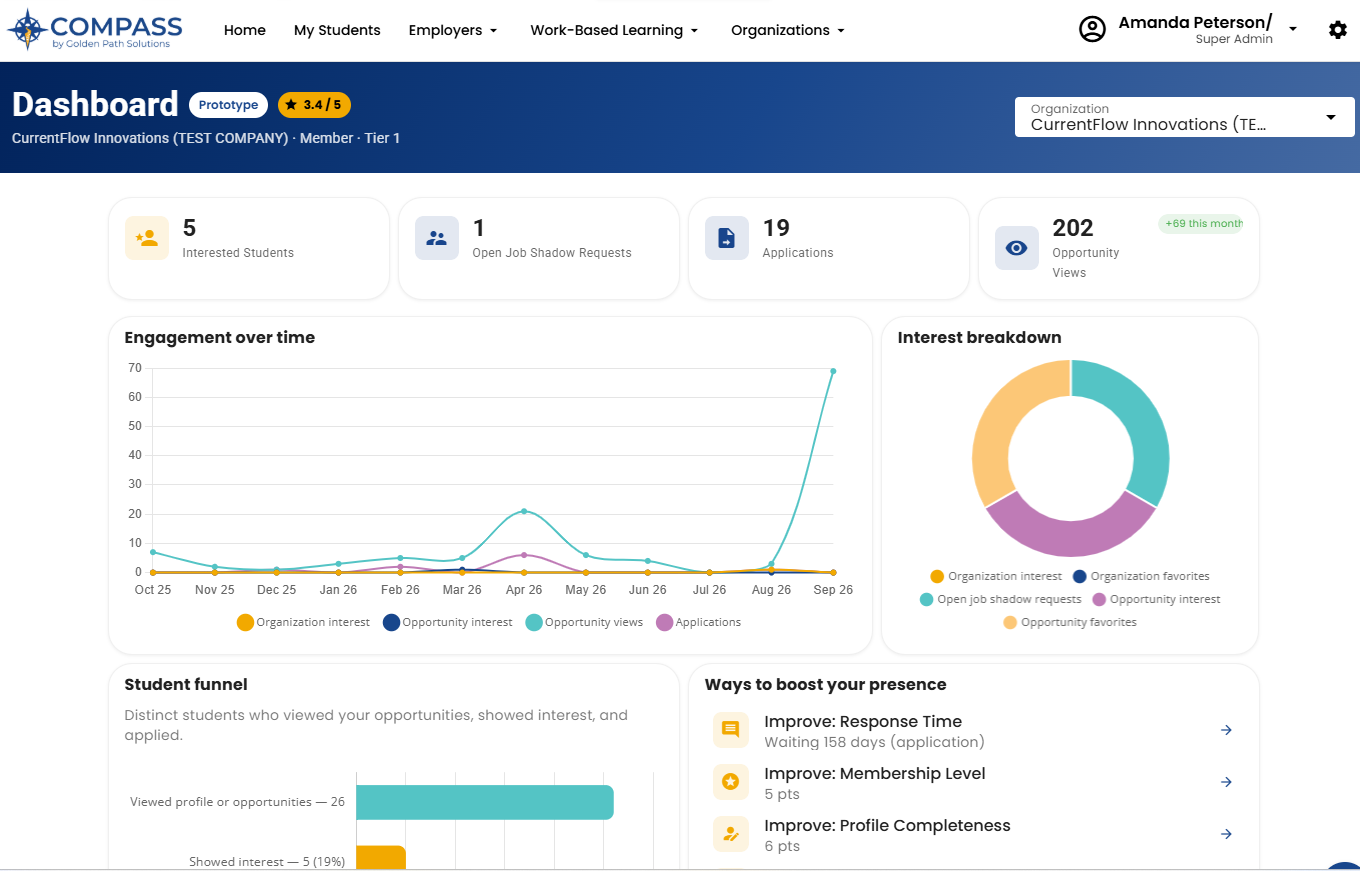
The new Compass Dashboard brings your key Compass analytics into one place, helping you see what’s getting attention, where students are showing interest, and where you may have opportunities to build stronger connections.
From opportunity clicks and favorites to student views and even the schools and classes teaching skills related to your careers, the Dashboard can help you make more informed decisions about where to focus your efforts.
You’ll also find the new Compass Engagement Score. It uses your Compass activity to suggest practical ways to strengthen your presence and increase student engagement.
Both are currently available to all paid Golden Path employer members, with additional student connection data available for Connections members and above.
Together, these tools can help answer an important question: What should we do next to connect with more students?
Here’s how:
See how students are engaging
Find the information you need to better understand student interest and inform your next steps. Dashboard analytics include:
- Engagement Over Time: Track demonstrated interest in your organization and opportunities, including opportunity views and applications.
- Interest Breakdown: Compare how students are interacting with different features in Compass, including favorited opportunities and job shadow requests.
- Student Funnel: See how distinct students move from viewing your opportunities to showing interest and applying.
- Profile and Opportunity Views: Assess student views by day, month, six months, or all time (since January 2026 when we started tracking in preparation for Dashboard).
- Views by School: See which schools are showing the most interest in your company and careers.
You can dig further into this information in the Explore section to better understand the student talent developing in your region. For example, you can see which classes are teaching skills you’re looking for and, when applicable, how many students have those classes on their Four-Year Rolling Plans by school.
Connections members and higher can take that information one step further with access to the names and emails of students who have indicated they would like to connect with your company. Find them under Explore >> Student Connections.
Know what to do next
Not sure where to focus first? All paid employer members now have access to the Compass Engagement Score.
This feature gives you a quick assessment of how fully you’re using the tools available to you in Compass and provides practical suggestions for strengthening your presence. Your next step might be completing your employer profile, responding sooner to student applications, offering a job shadow, or posting a Career Profile.
You don’t need to do everything at once. Instead, use the recommendations to identify where you have room to improve and choose the actions that make the most sense for your organization.
Turn your data into action
The real value of your Compass data is what you can do with it. Use what you learn to make more informed decisions about how and where you connect with students.
Here are a few ways to put your data to work:
- Measure the impact of a career fair. Use your Compass career fair resources to encourage students to learn more about your organization and connect with you. After the event, review your activity to see what students explored and use those insights to inform what you highlight at your next career fair.
- Connect with students developing the skills you need. See which classes are teaching skills relevant to your careers. Then use the Employer Connections Database to reach out to schools about speaking to a class, participating in an event, or finding another way to connect with those students.
- Give your opportunities more visibility. Identify opportunities that could use more attention. Then use your employer marketing resources (provided by Golden Path) to help generate interest. Share Open URLs on social media, use co-branded materials at career fairs, or find other ways to direct students to your Compass content. Employer Marketing Resources are included with all paid memberships and available under Employer Guides in Compass.
- Turn student interests into experiences. Look for trends in the classes and the subjects students are interested in and consider how they relate to your careers. Those insights could help you identify opportunities to offer job shadows or other work-based learning experiences to schools in your region.
Learn how to use your Compass Dashboard
Join us for a one-hour webinar, Get Started with Compass Dashboard, to explore how to use your data to understand student engagement better, strengthen your presence, and build more connections in Compass.
Register for the free Eventbrite webinar that works best for you:
- 1 p.m. Wednesday, Sept. 30
- 1 p.m. Wednesday, Oct. 21
Start exploring your data
Ready to learn more about how students are interacting with your organization and where you can strengthen your connections? Check out your Dashboard in Compass.
Dashboard analytics and the Compass Engagement Score are available with an Awareness Membership ($500 annually) and higher. You can upgrade your membership in the top right corner of Compass.
Contact us if you have questions about Dashboard or would like help putting your data to work.